
On a typical 40-stop day, an optimized route was 13% shorter by road than the way most couriers plan by instinct. That is the median result across 60 simulated delivery routes in Warsaw, Kraków and Wrocław. Measured as straight lines, the saving is about 6 km per 40-stop shift.
Forty stops, one van, one question
It’s 7:30 in Warsaw. The scanner shows 40 parcels for Mokotów, Wola and a few stragglers in Ochota. Most couriers do what any sensible person would: drive to the nearest address, then the next nearest, and so on.
That habit feels efficient. Each step is short. But by the afternoon you are often crossing back over ground you already covered, chasing the last few addresses the "nearest next" logic left behind.
We wanted to know how much that costs. So we built a test.
The experiment
We generated 60 delivery days: 20 each in Warsaw, Kraków and Wrocław. Each day has 40 stops scattered within 5 km of the city centre. The courier starts at the edge of that circle, as if arriving from a depot, and does not need to return.
Then we ordered the same 40 stops four ways:
- As listed. Stops in the order they arrived, the way a manifest prints them.
- Sweep by direction. Go around the city like a clock hand, neighbourhood by neighbourhood.
- Nearest next. Always drive to the closest address you haven’t visited yet. This is how most experienced couriers plan in their heads.
- Optimized. A route-optimization solver (Google OR-tools) looks at all 40 stops at once, with a 3-second time limit per route.
We measured each route as the straight-line distance between consecutive stops.
The results
The two percentages in this article are measured differently: the 12.4% below is the median straight-line saving of the OR-tools order over "nearest next" (43.0 km instead of 49.1 km), while the headline 13% is the median saving by road for Delivery Planner’s optimiser on the same 60 test routes (see the next section).
On straight lines, the optimized order beat "nearest next" by a median 12.4%: 43.0 km instead of 49.1 km. Half of all routes saved between 9.5% and 16.7%. Against the clockwise sweep, the gap grows to 30.6%.
"As listed" is the worst case by far, four times longer than optimized. Few couriers drive in raw manifest order, but it shows why the order of stops matters more than speed.
What Delivery Planner’s optimiser does
We then ran the same 60 routes through the optimiser inside Delivery Planner, the one behind the Optimise button. By road, its routes were 13.4% shorter than nearest-next (median; half of all routes saved between 9.4% and 18.1%). That is 92.7 km instead of 109.5 km, and only 1 route in 60 came out longer.
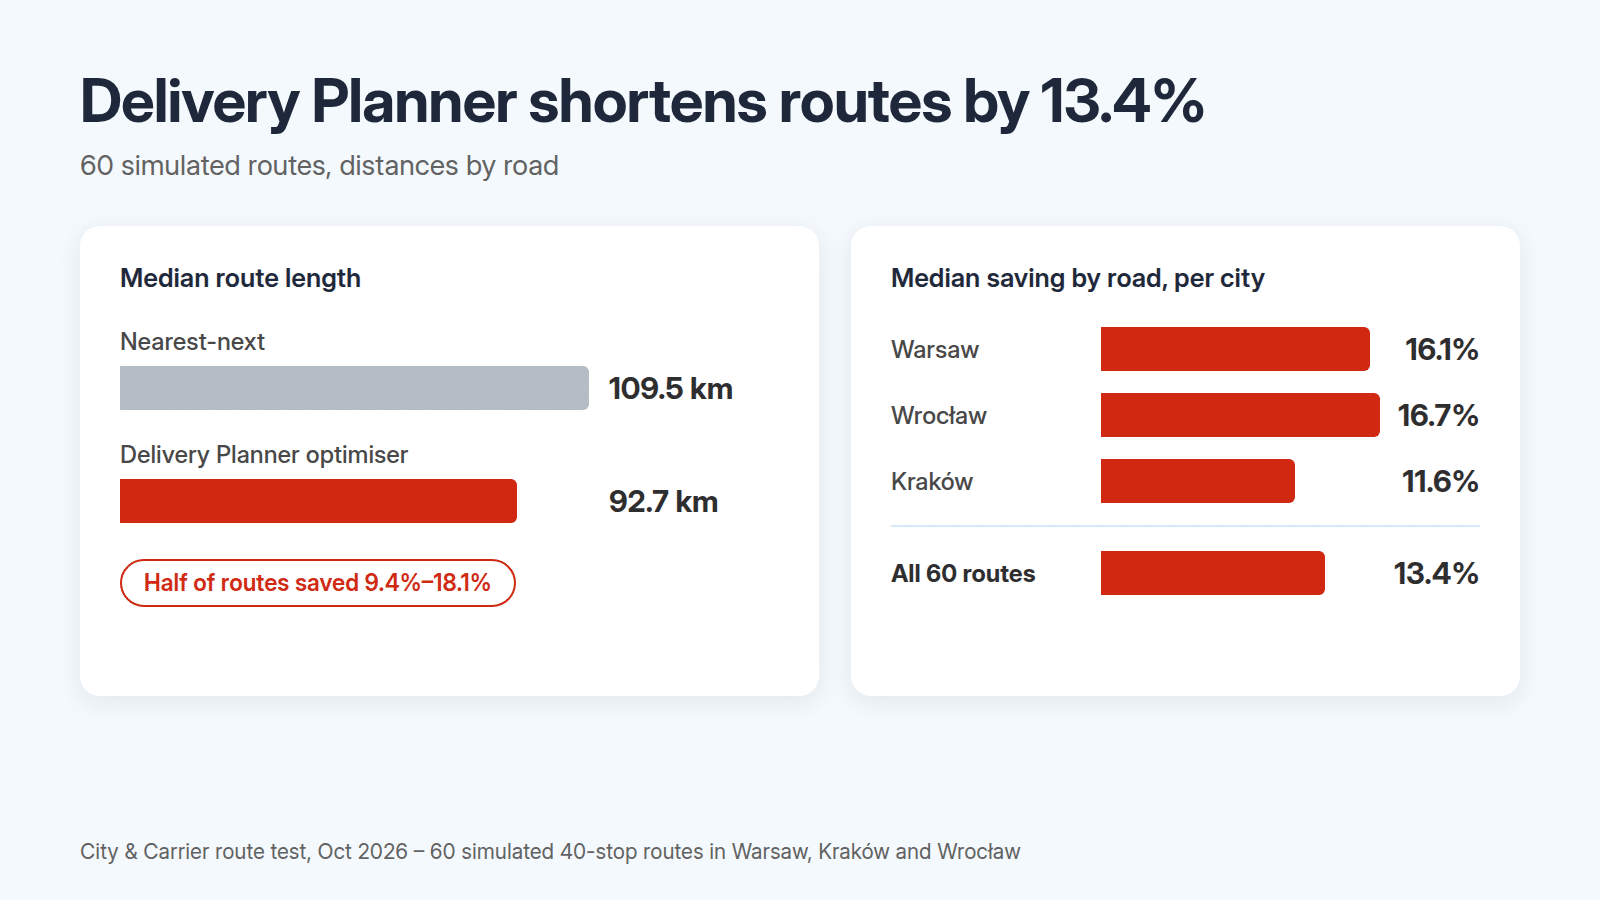
| City | Saving by road (median) |
|---|---|
| Warsaw | 16.1% |
| Wrocław | 16.7% |
| Kraków | 11.6% |
One honest detail: measured as straight lines, the app’s routes were not shorter. That is by design. Delivery Planner plans for driving time on real streets, with one-way systems, bridges and turns, not for the shortest line on a map. On the road, which is where a courier actually drives, that is what saves the kilometres.
What 13% means on the road
Measured by road, the median 40-stop route was 109.5 km planned nearest-next and 92.7 km with Delivery Planner’s optimiser. That is about 17 km less on every shift, with the same stops.
| Period | Distance saved by road |
|---|---|
| One 40-stop shift | ~17 km |
| A 5-day week | ~84 km |
| A month (22 shifts) | ~370 km |
These figures multiply the gap between the two median routes. Single days vary: half of the routes saved between 9.4% and 18.1%, which is roughly 10 to 20 km on a route of median length.
For a van using about 9 L per 100 km (our assumption, not a test result), 370 km is roughly 33 litres of fuel a month. The 6 km in the lead is a different measure: the straight-line saving of the OR-tools order. The 17 km here is measured by road for Delivery Planner’s optimiser on the same 60 routes.
Fuel is only part of it: fewer kilometres every day also means less wear on the van, without driving any faster.
What this test does and doesn’t tell you
We kept the test simple and honest. Here is what to keep in mind:
- Simulated, not real. The stops are random points, not real customer addresses. We deliberately used no driver or customer data.
- Straight lines, not roads. Distances are measured as the crow flies. Rivers, one-way streets and bridges change real routes.
- No time windows. Real days include "after 14:00" deliveries and business hours, which limit how much any route can be improved.
- Uniform spread. Real stops cluster in apartment blocks and business parks. Savings may be higher or lower there.
The results were consistent: in all 60 routes the optimized order was never longer than any of the three alternatives. Against "nearest next", the savings ranged from under 1% to 25%.
The test is fully reproducible. Every route is generated from a fixed random seed, so anyone can rebuild the same 60 days and check our numbers. Want the script? Write to us and we’ll send it.
Related reading: the definitive guide to route optimization explains the methods behind these numbers, and the free route planner for up to 50 stops lets you test them on your own addresses. All our guides and research in one place: route optimization guides and research.
Try it on your own route
The easiest way to see the difference is to plan tomorrow’s stops both ways. Delivery Planner is a free route planner for couriers on iOS and Android. Add up to 50 stops by typing, voice or a photo of the label, tap Optimize, and start navigating.
No trial period and no credit card. Plan as many routes as you need (fair use).


